ECON 140W - Week 10
Class - Mar. 17, 2026
Canadian Economic Updates
- February Labour Force Survey (March 13th)
- Employment down by 84,000
- Unemployment rate up to 6.7%
- Hourly wages up 3.9% year over year
- Youth unemployment rate in Ontario up to 15.9% (up from 14.4% a year ago)
- Aged 15-19: up from 20% to 26.1%
- Aged 20-24: down from 11.9% to 11.6%
- February Consumer Price Index (March 16th)
- Headline inflation - 1.8% down from 2.2%
- Base year effects still counting in food from restaurants
Canadian Debt Statistics
- Q4 Financial Data released today (March 17)
- Rising Canadian debt levels - household debt/disposable income
- 94% in 1992 to 177% today (last 10 years are flat)
- Last 10 years has been pretty flat
- This is a weird comparison because you don't intend to pay off your entire mortgage this year
- 94% in 1992 to 177% today (last 10 years are flat)
- Rising assets levels as well - net worth/disposable income
- 543% in 1992 to 1,006% today
- Debt to total assets constant
- 15% in 1992 to 15% in 2025 (high of 19% in 2010)
- Therefore, whenever you say that households are worse off, is just not true.
Macroeconomics Models
- IS-MP-PC model is important and we use it regularly
- Really good at understanding short-run effects
- How does monetary policy respond and how does fiscal policy respond?
- However, thinking about more than a few months, what happens next?
- Or, for example, if productivity increase happens, that doesn't show up as an increase in GDP in IS-MP-PC model
- Aggregate Demand/Supply
- Better at long-run transition
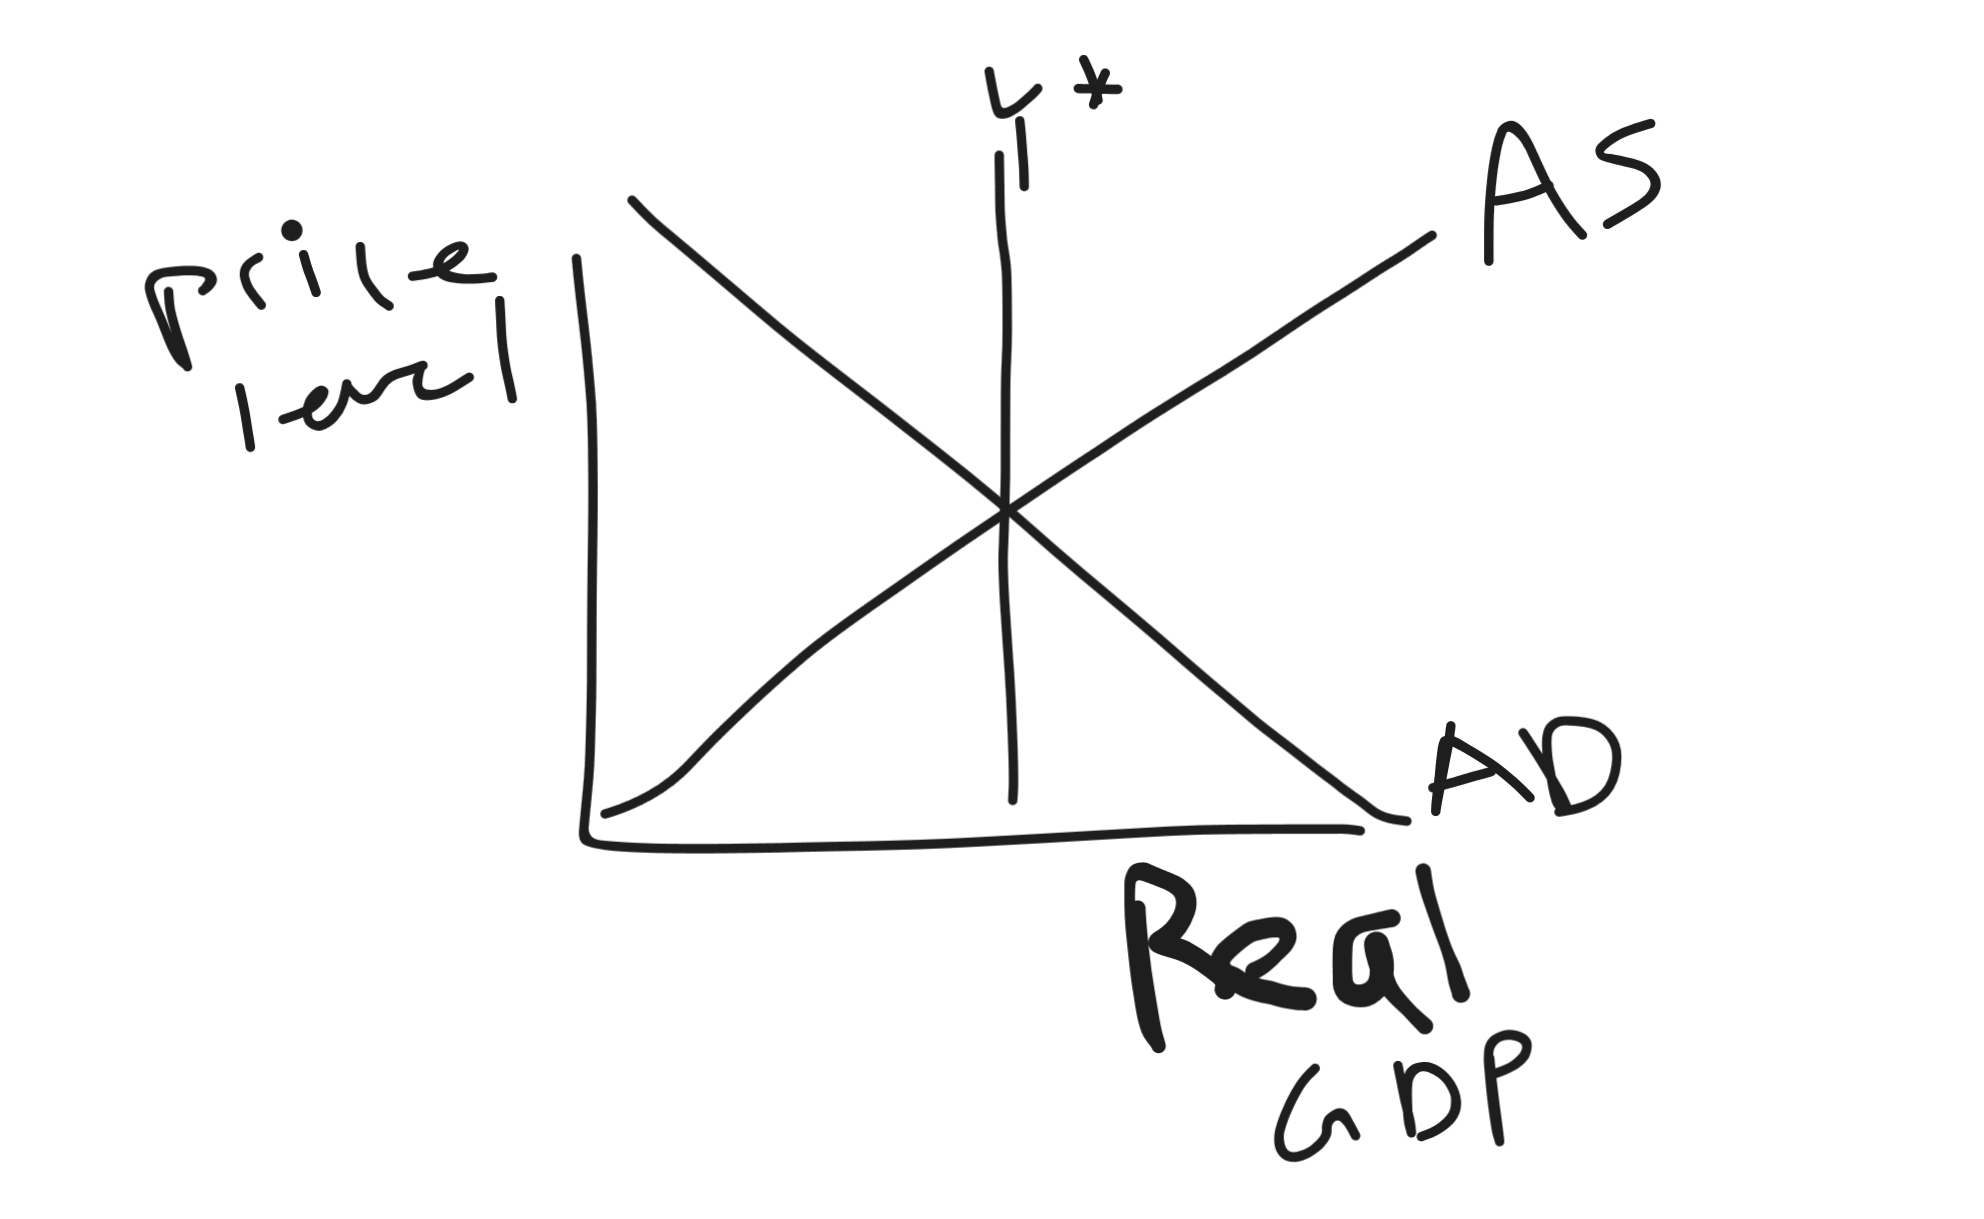
Where Y* is potential GDP
- Better at long-run transition
Long-Run Goals of Economic Policy
- Monetary policy is basically entirely on short-run
- Long-run goals:
- Income, GDP per capita
- Productivity (GDP per worker)
- Equality
- Education
- Health-care
- Something else?
Solow-model:
- Increasing one might decrease the other
Short-Run Goals of Economic Policy
- Economic growth?
- Awkward to think about
- What could Gov. Can. do to increase economic growth in the next year
- Price stability (2% inflation)
- Employment stability
- Unemployment rates being steady
- Equality
- Quality of life
- Random generic that doesn't mean anything
- Anything else?
Tools for Economic Policy
- Government policy options
- Tax policy
- Total taxes collected, and distribution/incentive effects
- Government transfers
- Total money transferred, and distribution/incentive effects
- Do you give money to lower incomes/based on age/disability etc.?
- EI would fall into this bucket
- Government purchases/spending
- Total, and where its spent
- Consumption
- Investment
- Is health-care spending investment or consumption?
- It kind of blurs the lines what falls into each of those buckets
- When government actually buys something (ex. teacher)
- Total, and where its spent
- Monetary policy
- Interest rates, quantitative easing
- Tax policy
Issues in Long-Run Economic Policy
- Long-run economic growth - Solow model
- Technology, physical capital, human capital, labour
- Encouraging each element requires different policy
- If you want to spend more money on education, then human capital increases, but what is the consequence of doing that?
- That might mean less investment and lower physical capital
- If you want to spend more money on education, then human capital increases, but what is the consequence of doing that?
- Optimal size of government
- Public vs. private mix of each element
- Within education, there's a mix -> primary school is essentially all public, university if about half and half
- Technology is a weird mix of companies pursing R & D on their products
- However, there is also publicly funded educations that do research that might support technology for those companies
- Implications for inequality
- Public vs. private mix of each element
Crowding Out
Government
- Does government spending crowd out private investment?
- Short-run?
- Long-run?
- Y = C + I + G + NX
- If government spending goes up
- Consumption, Investment, Net exports go down
IS-MP-MC Model
Loanable Funds Model
## Short Run Economic Policy - Can fiscal policy stabilize the economy? - Laz building - response to 2009 global financial crisis - Private spending as well as public spending due to a policy to build a new building to get out of the recession - Before was a primary school here, so they tore down the building, dug a deep hole, and nothing was built until 2013 - Therefore, a fiscal policy to build new buildings is really slow - CERB - Canadian Emergency Response Benefit - Started because of COVID-19 - Government had to decide they want to do this, then get it passed through Parliaments as legislation, then they must do it - Usually, this takes months but CERB took 1 month - Government didn't question if you filled out a form for CERB - It was not expansionary fiscal policy, it was more stabilization - Counter-cyclical fiscal policy - Multiplier effects - If you go into a recession, and want to use fiscal policy to combat it, then you must shift IS curve to the right. - How far the IS curve shifts to the right, you have a multiplier effect (when you spend it, how you spend it) to know how to stabilize the economy - Time lags - We want shovel-ready projects but there's very few - Most common is road-refinishing - Discretionary vs. automatic stabilizersAutomatic Fiscal Stabilizers
- Discretionary policy can be far too slow
- Automatic stabilizers are critical
- Progressive tax rates
- If people earn more money, Gov Can collects more taxes, economy slows a little bit and automatically shifts curves
- Employment insurance system
- Progressive tax rates
- Modeling automatic stabilizers
- Reduces multiplier effects
- Limit shifts in IS or AD curves
Timing Discretionary Economic Policy
- Ex. Laz building, World Cup and Olympics
- Can World Cup save Canada from a recession?
- Far too small, so no
- Multiplier effects suggest effect on GDP far less than $5 billion
- Normally - impossible to time events to economic outcomes
- 2010 Olympics were well-times (by accident)
Class - Mar. 19, 2026
AD/AS Framework
- Aggregate demand replaces the IS curve - measuring spending - Aggregate supply replaces the Phillips curve - measures output - Where did monetary policy go? - Partly within AD curve - Partly reflected in shifts in the AD curve - When we talk about this, we probably just use IS-MP-PC - Macroeconomic equilibrium - Intersection of AD and AS ## Aggregate Demand - Aggregate expenditure: Y = C + I + G + NX - AD is basically IS-curve plus - How do higher prices affect spending? - Interest-rate effect - Bank of Canada raises interest rates - Wealth effect - Higher prices cause consumers to feel poorer - Trade effect - Higher prices leads to lower exportsShifts in Aggregate Demand
- IS curve shifts plus MP curve shifts
- Consumption
- Wealth, taxes and transfers, confidence
- Investment
- Confidence, corporate taxes risk premium
- Looking back 20 years, an IS-MP model did not exist in first year, but then the financial crisis happened
- Confidence, corporate taxes risk premium
- Government purchases
- Net exports
- Global growth, exchange rates, etc.
- NOTE: We don't care about the slope of the AD curve, just know it's negative
Aggregate Supply
- Much more political and contested
- How much do companies produce?
- Companies raise prices when output increases
- Aggregate supply is upward sloping
- Represents how much we produce in the economy
- Represents output-gap inflation
- Costs rise when producing more
- Companies with market power raise prices when sales increase
Aggregate Supply Shifts
- Why does the AS curve shift?
- Same reasons that the Phillips curve shifts
- Supply shocks
- Higher costs are negative supply shocks
- Shift AS curve to the left
- Like higher price of oil
- Input prices (including wages)
- Productivity
- Exchange rates
- Depreciation of the Canadian dollars creates a shift to the left
- Higher costs are negative supply shocks
Macroeconomic Equilibrium
- Equilibrium income and prices when AD=AS
- When AD or AS shift, output changes and price change
- Interpret higher price level as inflation
- Think about changes in output relative to the output gap
Monetary and Fiscal Policy
In general, monetary policy comes first
- Monetary policy - interest rates and the money supply
- Bank of Canada changes interest rates for two reasons
- Controlling inflation (may be built into the AD curve)
- Maintaining output and employment
- Lower than expected interest rates are expansionary monetary policy
- Bank of Canada changes interest rates for two reasons
- Fiscal policy
- Government of Canada controls fiscal policy
- Tax rates, transfers to households, government purchases
- Higher spending or lower taxes - expansionary fiscal policy
- Government of Canada controls fiscal policy
Multiplier Effect
- If government spends money, how much does GDP change?
- Measure in the multiplier effect
- Change in output = change in spending times multiplier
-
- Where G is the government spending and m is the multiplier
- How big is the multiplier?
- Roughly between 0.5 and 1.5
- How can it be less than 1? You have to look to its constraints
- The way your AS looks (its shape aka its slope)
- Lots of factors matter
- Tax rates, imports, MPC
- Roughly between 0.5 and 1.5
IS-MP-PC vs. AD-AS: Rise in Exports
IS-MP-PC vs. AD/AS: Supply Shocks
Slope of the Aggregate Supply Curve
- What is the slope of the aggregate supply curve? And is it a straight line?
- Many versions imply an increasing slope
- The idea: there's a range roughly around zero output gap (aka at Potential GDP). If we're at a recession, then it's fairly flat, whereas if we're at a positive output gap, then the curve is pretty steep
- Implications
- Prices drop slowly in recessions but rise quickly in expansions
- GDP falls more in recessions than it rises in expansion
- Multiplier depends on economic conditions