Chapter 19 - Notes
19.1 - Three Inflationary Forces
The Big Picture Formula:
Inflation = Inflation expectations + Demand-pull inflation + Cost-push inflation (supply shocks)
The Three Forces Explained
1. Inflation Expectations
- Inflation expectations: the rate at which average prices are anticipated to rise next year
- If managers expect 2% inflation next year, they'll raise their prices by ~2% to keep up (because their input costs — wages, rent, materials — will also rise ~2%)
- When millions of businesses all do this → inflation expectations create inflation
- It's self-fulfilling: if everyone expects 2% inflation and raises prices accordingly, you get 2% inflation
2. Demand-Pull Inflation
- Demand-pull inflation: arises when demand exceeds the economy's productive capacity, pulling prices up
- When actual output > potential output (positive output gap) → businesses can't keep up with demand → they raise prices → inflation rises
- When actual output < potential output (negative output gap) → businesses have excess capacity → they moderate price increases → inflation falls
- The relationship between the output gap and inflation is described by the Phillips curve (covered in detail later)
3. Cost-Push Inflation (Supply Shocks)
- Cost-push inflation: prices rise in response to an unexpected rise in production costs
- Caused by supply shocks — unexpected events that raise costs across many businesses
- Examples: shipping container shortages, port congestion, supply chain disruptions, floods knocking out freight lines, rising transportation costs, higher input prices
- COVID recovery example: ports clogged, containers misplaced, workers sick → costs rose across many sectors → businesses raised prices → inflation
- The interdependence principle is key here — a cost increase in one sector (transportation) ripples through many others
19.2 - Inflation Expectations
Why Inflation Expectations Matter
Two factors drive pricing decisions, and inflation expectations affect both:
- Marginal costs: if you expect 2% inflation, your suppliers will likely raise their prices ~2% → your costs rise ~2% → you need to raise your prices ~2% to maintain profit margins
- Competitors' prices: if you expect 2% inflation, your competitors will likely raise their prices ~2% → you should match to stay competitive
Result: if the average manager expects 2% inflation, they raise prices by 2% → millions of managers doing this → you GET 2% inflation
Inflation expectations are self-fulfilling:
- Expect 2% → raise prices 2% → 2% inflation happens
- Expect 6% → raise prices 6% → 6% inflation happens
- ANY inflation rate can become a long-run equilibrium through this mechanism
Vicious vs Virtuous Cycles
- Vicious cycle (high-inflation countries): expect high inflation → raise prices a lot → high inflation → expect high inflation → repeat
- Virtuous cycle (Canada, recent decades): expect low inflation → raise prices modestly → low inflation → expect low inflation → repeat
- Policy implication: the key to low inflation in the long run is convincing people inflation will be low — once they believe it, it becomes true
- This is why the Bank of Canada's credibility matters enormously
Three Ways to Measure Inflation Expectations
1. Surveys
- Ask people directly what they expect inflation to be
- Bank of Canada surveys ask about 1-year and 5-year expectations
- Short-term expectations (1 year) move around more; long-term expectations (5 years) are more stable
- In 2021, short-run expectations rose but 5-year expectations didn't budge → people expected inflation spike was temporary
2. Professional Economist Forecasts
- Survey professional forecasters for their inflation predictions
- More accurate than the general public
- The average of many economists beats any individual forecaster
- Government publishes the average forecast from private-sector banks in the federal budget
3. Financial Markets (Bond-Based)
- Compare yields on real-return bonds (adjust for inflation) vs regular nominal bonds
- The difference ≈ expected inflation
- e.g., nominal bond yields 3.2%, real-return bond yields 1% → expected inflation ≈ 2.2%
- Reflects collective wisdom of sophisticated traders in real time
- Downside: real-return bond market is small → can be noisy
Four Types of Inflation Expectations
- Adaptive: expect recent inflation to continue (backward-looking)
- Anchored: believe the Bank of Canada will deliver on its ~2% target
- Rational: use all available data and deep macro understanding to form the most accurate forecast possible
- Sticky: people don't update their views frequently, so expectations change slowly
In reality, most people use some combination of all four
19.3 The Phillips Curve
Demand-Pull Inflation
- Excess demand (positive output gap): businesses can't keep up with demand → raise prices more than expected → inflation rises ABOVE inflation expectations
- Insufficient demand (negative output gap): businesses have excess capacity → show price restraint → inflation falls BELOW inflation expectations
- Demand matches capacity (output gap = 0): no demand-pull pressure → inflation EQUALS inflation expectations
The Phillips Curve
- Phillips curve: graphs the relationship between the output gap (horizontal axis) and unexpected inflation (vertical axis)
- Unexpected inflation = Actual inflation − Inflation expectations
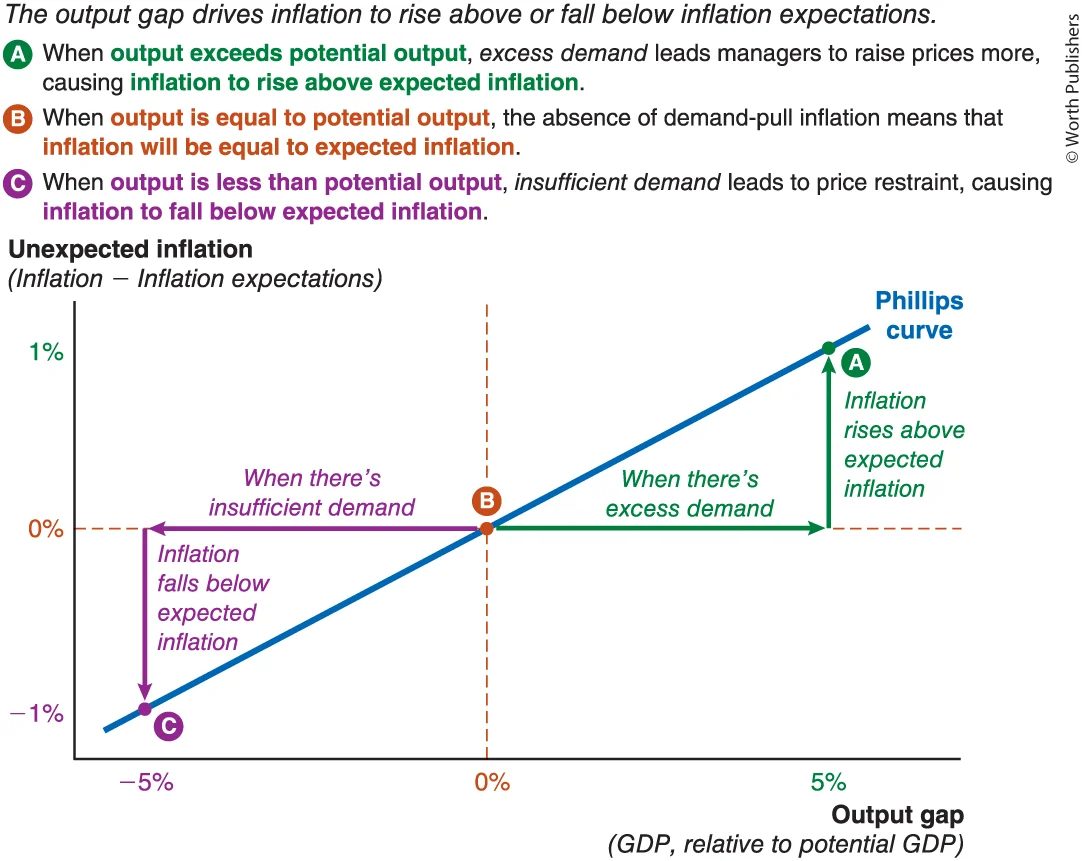
Key Features:
- Upward-sloping: more positive output gap → more unexpected inflation
- Passes through the origin: when output gap = 0, unexpected inflation = 0 (inflation = expectations)
- When unexpected inflation is positive → actual inflation is above expectations
- When unexpected inflation is negative → actual inflation is below expectations (doesn't mean prices are falling, just rising slower than expected)
How to Use the Phillips Curve to Forecast Inflation (Two Steps)
- Assess inflation expectations (from surveys, economist forecasts, or bond market data)
- Use the Phillips curve to forecast unexpected inflation: find your output gap on the horizontal axis → read up to the curve → read across to find unexpected inflation
Inflation forecast = Inflation expectations + Unexpected inflation (from Phillips curve)
- e.g., inflation expectations = 2%, output gap = +5%, Phillips curve says unexpected inflation = 1% → forecast inflation = 2% + 1% = 3%
The Labour Market Phillips Curve (Alternative Version)
- Instead of the output gap on the horizontal axis, uses the unemployment rate
- An inverse relationship between unemployment and unexpected inflation.
- Same ideas, just a different measure of excess demand
- Downward-sloping (opposite direction from the regular Phillips curve) — but this is purely cosmetic:
- Excess demand = high output gap = LOW unemployment → both versions say inflation rises
- Insufficient demand = negative output gap = HIGH unemployment → both versions say inflation falls
- Connected by Okun's rule: high unemployment ↔ negative output gap, low unemployment ↔ positive output gap
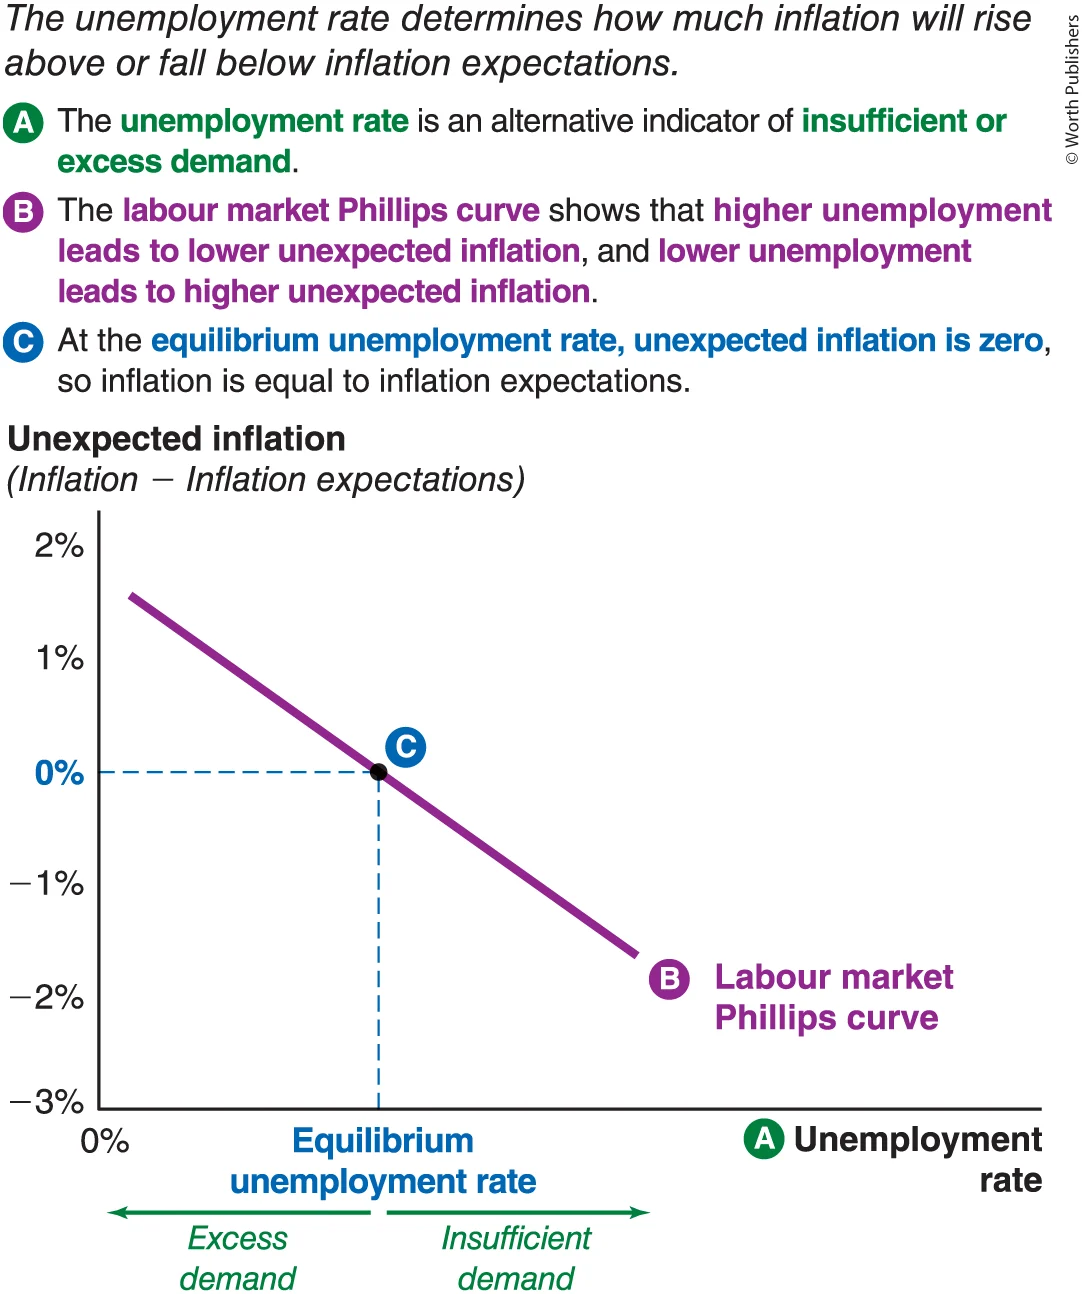
Equilibrium unemployment rate (also called "natural rate" or NAIRU): - The unemployment rate where unexpected inflation = 0 (inflation is stable at expectations)
- Not zero — frictional and structural unemployment still exist (Chapter 11)
- Economists debate the exact number but it's roughly between 3% and 6%
- Unemployment below this → inflation creeps up
- Unemployment above this → inflation falls
19.4 - Supply Shocks Shift the Phillips Curve
Cost-Push Inflation (Inflation Force #3)
- Cost-push inflation: an unexpected rise in production costs pushes sellers to raise prices
- This is a SEPARATE force from inflation expectations and demand-pull — it causes higher inflation at ANY given output gap
- Rising production costs → Phillips curve shifts UP
- Falling production costs → Phillips curve shifts DOWN
Three Types of Supply Shocks
1. Input Prices
- Rising input prices → higher marginal costs → businesses raise prices → Phillips curve shifts UP
- Oil prices are the most important — oil is used for electricity, gasoline, diesel, plastic, heating, transportation → ripple effects throughout the entire economy
- 1973 oil embargo: oil price quadrupled → US inflation shot from 6% to 12%
- Commodity prices (especially agricultural) — severe weather disrupts harvests → feed prices rise → meat prices rise → cost-push inflation rises
- Wages — rising wages raise marginal costs → businesses raise prices
- Wage-price spiral: workers demand higher wages because of inflation → businesses raise prices because of higher wages → workers demand even higher wages → and so on
- This is dangerous because it can make a temporary inflation shock persistent — inflation keeps going long after the original cause is gone
- Dollarama example: executives warned higher wages would eventually be passed on to customers
2. Productivity
- Faster-than-expected productivity growth → need fewer inputs per unit of output → lower marginal costs → Phillips curve shifts DOWN (good news for inflation)
- Slower-than-expected productivity growth → costs rise → Phillips curve shifts UP
- 1970s example: productivity growth slowed but wages kept rising fast → costs rose → cost-push inflation
3. Exchange Rates
- Canadian dollar depreciates → Phillips curve shifts UP
- Direct effect: imported goods cost more in C$ → higher prices
- Indirect effects (three channels):
- Businesses using imported inputs face higher costs → raise prices
- Businesses competing with imports face less competitive pressure (foreign rivals now more expensive) → raise prices
- Exporters find foreign customers willing to pay more (in C$) → may raise domestic prices too
- Canadian dollar appreciates → Phillips curve shifts DOWN (all the above in reverse)
Movements Along vs Shifts of the Phillips Curve
| Movement ALONG | Shift | |
|---|---|---|
| Cause | Change in output gap (demand-pull) | Change in production costs (supply shock) |
| Example | Economy booms → output gap rises → move up along the curve | Oil prices spike → costs rise → curve shifts up |
| Output gap and inflation move... | Same direction (both up or both down) | Can move opposite directions (inflation up while output down) |
Where Do Inflation Expectations Fit?
- Inflation expectations neither shift the Phillips curve nor cause movement along it
- They determine the baseline level of inflation
- Total inflation = expected inflation + unexpected inflation (from Phillips curve)
- Phillips curve explains short-run deviations from expectations
- Inflation expectations explain the long-run level of inflation
How to Diagnose What's Happening
- Output gap and inflation move in the same direction → demand shock (movement along Phillips curve)
- Inflation rises while output falls (double whammy) → supply shock (Phillips curve shifted up)
- Inflation rises in line with inflation expectations → expectations have shifted
Questions
- The labour market Phills curve shows:'
an inverse relationship between unemployment and the output gap.