Chapter 17 - Notes
17.1 - Macroeconomic Trends and Cycles
Key Definitions
- Potential output: the level of output when all resources are fully employed — the maximum sustainable level of production
- Determined by quantity/quality of workers, capital, and ideas about how to combine them
- Business cycle: short-term fluctuations in economic activity around potential output
- Canada's long-run GDP growth per person has averaged 1.9% per year for over a century
The Output Gap
- Output gap = ((Actual output − Potential output) / Potential output) × 100
- Negative output gap: actual output < potential → idle resources, unemployment, unused equipment, shuttered businesses
- Positive output gap: actual output > potential → economy running unsustainably hot — people working extra shifts, factories deferring repairs, prices rising
- Like cramming before an exam — you can push above sustainable effort temporarily, but not forever
- Output gap = 0: economy producing at its maximum sustainable level — the ideal
Stages of the Business Cycle
- Peak: high point in economic activity, followed by a decline
- Trough: low point in economic activity
- Recession (contraction): the period between a peak and a trough — output is falling
- A really bad recession = depression
- Expansion: the period between a trough and a peak — output is growing
- Expansions don't die of old age — they keep going until killed by an adverse shock (financial crash, pandemic, collapse in confidence, trade disruption, etc.)
Levels vs Changes — Important Distinction
- Levels tell you where the economy IS (peaks, troughs, the output gap)
- Changes tell you where it's GOING (growth rates, whether expanding or contracting)
- A recession ends when GDP starts growing again (positive change), BUT the negative output gap doesn't close until actual output has grown enough to catch back up to potential — this can take years
- e.g., the economy can be in an expansion but still have a negative output gap because it hasn't fully recovered yet
Business Cycles Are NOT Actually Cyclical
- Despite the name, business cycles are irregular and unpredictable — not rhythmic
- Some expansions last 1 year, others last a decade
- The longest Canadian expansion: 1992 to 2008 (~16 years)
- Just because an expansion has been going on a long time does NOT mean a recession is coming
Recessions Are Painful
- Unemployment rises substantially during recessions and often keeps rising even after the recession officially ends
- People who graduate during recessions earn less even decades later
- Recessions cause widespread unhappiness — even for people who don't lose their jobs
- Businesses that might otherwise succeed can permanently shut down
The Great Moderation
- From late 1980s until COVID, the Canadian economy became less volatile (smaller fluctuations in GDP growth)
- Possible explanations: Bank of Canada got better at managing the economy, globalization provides demand abroad during domestic recessions, better inventory management, or just luck (fewer bad shocks)
- 2008 recession and COVID recession raised questions about whether the Great Moderation is truly over
17.2 - Common Characteristics of Business Cycles
Every Business Cycle is Unique, But They Share Common Features
1. Recessions Are Short and Sharp; Expansions Are Long and Gradual
- Average recession since WWII: ~1 year
- Average expansion: ~7 years
- Recessions involve steep, fast declines in output and sharp rises in unemployment
- Expansions are slow and gradual — can take years to fully heal
- Causes of recessions vary: oil price hikes, banking crises, high interest rates, pandemics, financial crises, etc.
2. The Business Cycle Is Persistent
- Current conditions are a good predictor of near-future conditions
- This year's output gap ≈ next year's output gap (changes are slow and unpredictable)
- Forecasters start with the assumption that whatever is happening now will likely continue
3. The Business Cycle Impacts Many Parts of the Economy (Co-movement)
- Different provinces rise and fall together — no province is immune from a recession, even if some are hit harder than others
- Different economic indicators rise and fall together — when GDP rises, so do industrial production, retail sales, employment, business profits, stock prices, investment, etc.
- Different industries rise and fall differently:
- Export-oriented sectors (manufacturing, resources) follow international demand more than the domestic cycle
- Domestic sectors (construction, retail, wholesale) follow the domestic business cycle more closely
- Resource sector is especially volatile — swings with commodity prices
- Public sector follows political decisions, not market conditions — government services demand can actually rise during recessions
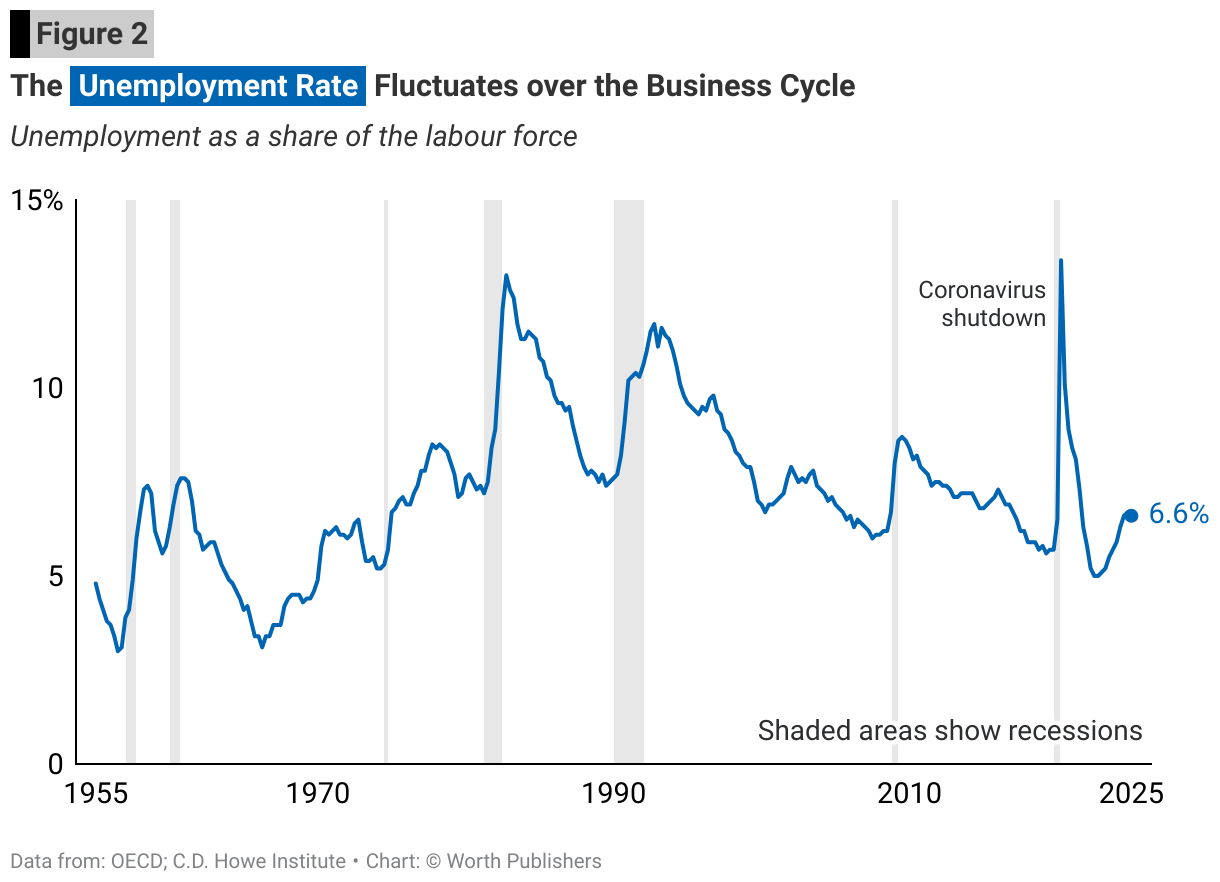
4. Leading vs Lagging Indicators
- Leading indicators: predict where the economy is headed — they change FIRST
- Examples: business confidence, consumer confidence, stock market
- e.g., consumers lose confidence before they actually cut spending
- Lagging indicators: follow business cycle movements with a delay
- Example: unemployment — managers are reluctant to lay off workers they've invested in until they're sure the downturn is real
Okun's Rule of Thumb
- Links the output gap to the unemployment rate
- For Canada: for every 1 percentage point that actual output is below potential, unemployment is about 1/3 of a percentage point higher
- e.g., output gap goes from 0 to −3% → unemployment rises by ~1 percentage point (say from 8% to 9%)
- When output = potential → unemployment = equilibrium unemployment rate
- Equilibrium unemployment rate isn't zero (frictional + structural unemployment still exist)
- Canada's equilibrium unemployment rate has averaged ~8% over the past 40 years
- When output > potential → unemployment below equilibrium
- When output < potential → unemployment above equilibrium
17.3 - Analyzing Macroeconomic Data
Basics of Macroeconomic Data
- Seasonally adjusted data: removes predictable seasonal patterns (e.g., hotel stays spike in summer, retail spikes before holidays) so you can see the underlying trend — usually what you want to use
- Annualized data: data from a shorter period (monthly/quarterly) converted to show what the rate would be if it continued for a full year — makes it easier to compare across different time periods
- Real vs Nominal: use real data to track the economy (adjusts for inflation, shows actual quantity changes) — nominal data mixes up price changes and quantity changes
- Data revisions: initial estimates are often revised substantially as more complete data comes in — can take ~3 years to finalize, so don't treat first releases as gospel
Top 10 Economic Indicators
- Real GDP — broadest measure of economic activity (total production, spending, income)
- Exports — tells you about Canada's big export sectors (energy, autos, etc.)
- Unemployment rate — measure of excess capacity in the labour market; released very quickly (a few days into each month)
- Payrolls (SEPH) — how many jobs created each month; cross-checks the unemployment rate
- Building permits — indicator of construction activity, which swings strongly with the business cycle
- Capacity utilization — what % of the economy's full capacity is being used (are factories running full tilt or sitting idle?)
- Retail sales — tells you if consumers are confident and spending
- Inflation (CPI) — rising inflation may signal economy above potential; falling inflation suggests unused resources
- Labour cost index — how fast wages and benefits are rising; leading indicator of inflationary pressure (higher costs → higher prices)
- Stock market (S&P/TSX Composite) — reflects investors' expectations about future business profits; often the first sign of strengthening/weakening economy, but can send false signals ("the stock market has predicted nine out of the last five recessions")
Why stock markets sometimes fall after good news: stock prices already reflect expectations, so what matters is whether data came in better or worse than expected, not whether the data is good or bad in absolute terms
Five Tips for Tracking the Economy
1. Track many indicators — no single indicator gives the full picture; the economy is too complex
- Big data revolution is creating new indicators (credit card spending, Google searches, social media)
2. Broad indicators beat narrow indicators — give more weight to indicators covering a larger share of the economy
- e.g., industrial production only covers ~1/5 of the economy — can mislead about broader trends
3. Seek just-in-time data and distinguish leading from lagging indicators
- Some data comes out in days (unemployment rate, stock market); GDP takes ~2 months after the quarter ends
- Leading indicators (confidence, stocks) tell you where the economy is headed
- Lagging indicators (unemployment) confirm where it's been
4. Find the signal amid the noise
- Data jumps around for random reasons — use a moving average (e.g., 12-month) to smooth out the noise
- Use core inflation (strips out volatile food/energy) rather than headline inflation to see the underlying trend
5. Adjust your outlook when data differ from expectations
- Data matching your expectations = no news
- Data stronger or weaker than expected = real news → update your forecast
Questions
- Assume that potential GDP in Canada in 2025 is $3,100 billion. If the impact of trade disruptions causes the average unemployment rate in Canada for 2025 to be 8%, as compared to the long-run equilibrium unemployment rate of 6%, then , by Okun's rule, we would expect actual GDP to be approximately:
Unemployment rate is 2% above expected.
So,, by Okun's rule.
So, Actual GDP = - Assume that the Canadian economy has a long-run equilibrium unemployment rate of 6.0%. If the Canadian economy has a real GDP of $2,900 billion, and a potential real GDP of $3,000 billion, then using Okun's rule of thumb, we can estimate that the unemployment rate will be approximately
Okay so using the formula for output gap, you get that it is $$-\frac{10}{3}$$
And, $$\text{Unemployment } = -\frac{1}{3}\times \text{ Output Gap}$$
So, cyclical unemployment is, adding that to the long-run unemployment, you get roughly 7.1%