Chapter 9 - Notes
9.1 - GDP and the Macroeconomy
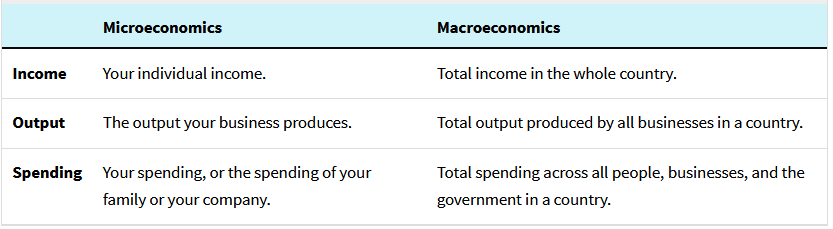
- Macroeconomics is the study of the economy as a whole - not individual decisions in specific markets
- Result of many micro decisions
- Shift from individual income, output, and spending to total amount of income, output, spending across households, levels of governments that make up the economy
The Circular Flow
- In macroeconomics, your choices depend on what others do, and what others do depend on what people like you do - this is the interdependence principle
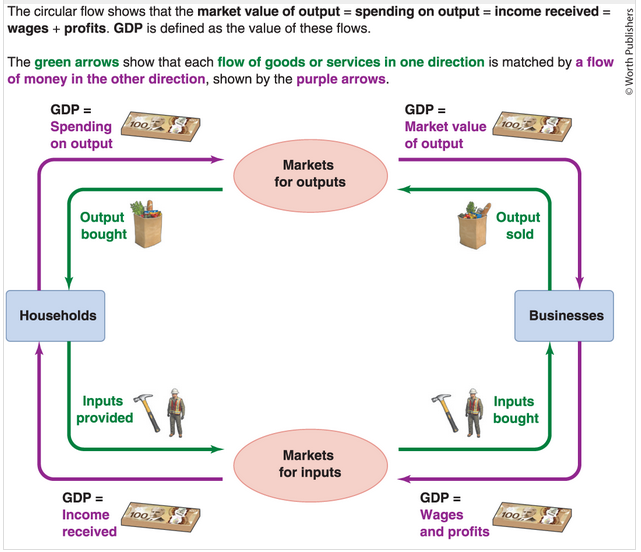
Purple = flow of money, green = flow of real resources
Total income = Total output = Total spending in an economy. This is an economy's GDP.
Definition of GDP
- GDP or Gross domestic product, is a measurement of economic activity
- It's definition is the market value of all final goods and services produced within a country in a year
- GDP tries to be comprehensive, but it doesn't include economic activity that occurs outside of markets
- For example, buying a vacuum from Walmart contributes to GDP but your services cleaning your house does NOT.
- Only counts final goods and services.
- A couch from Leon's Furniture is considered a final product because you're the final user.
- GDP does NOT include intermediate goods, which are goods and services used as inputs in the production of other products
- If you count the cost of a couch and the wood that went into it, you're essentially double counting the wood
- GDP measures production, so it doesn't count resale of existing finished goods
- For example, buying a couch on Facebook Marketplace does NOT add to the GDP.
- Measures domestically produced items. Even if goods are sold outside of Canada, it is still counted toward the GDP.
- Usually measured every 4 months (every quarter) and then add up the production of the four quarters.
- Adding up everything such as apples, wheat, haircuts, hot dogs, natural gas, education, housing, cars, shoes, and literally everything else!
- GDP tries to be comprehensive, but it doesn't include economic activity that occurs outside of markets
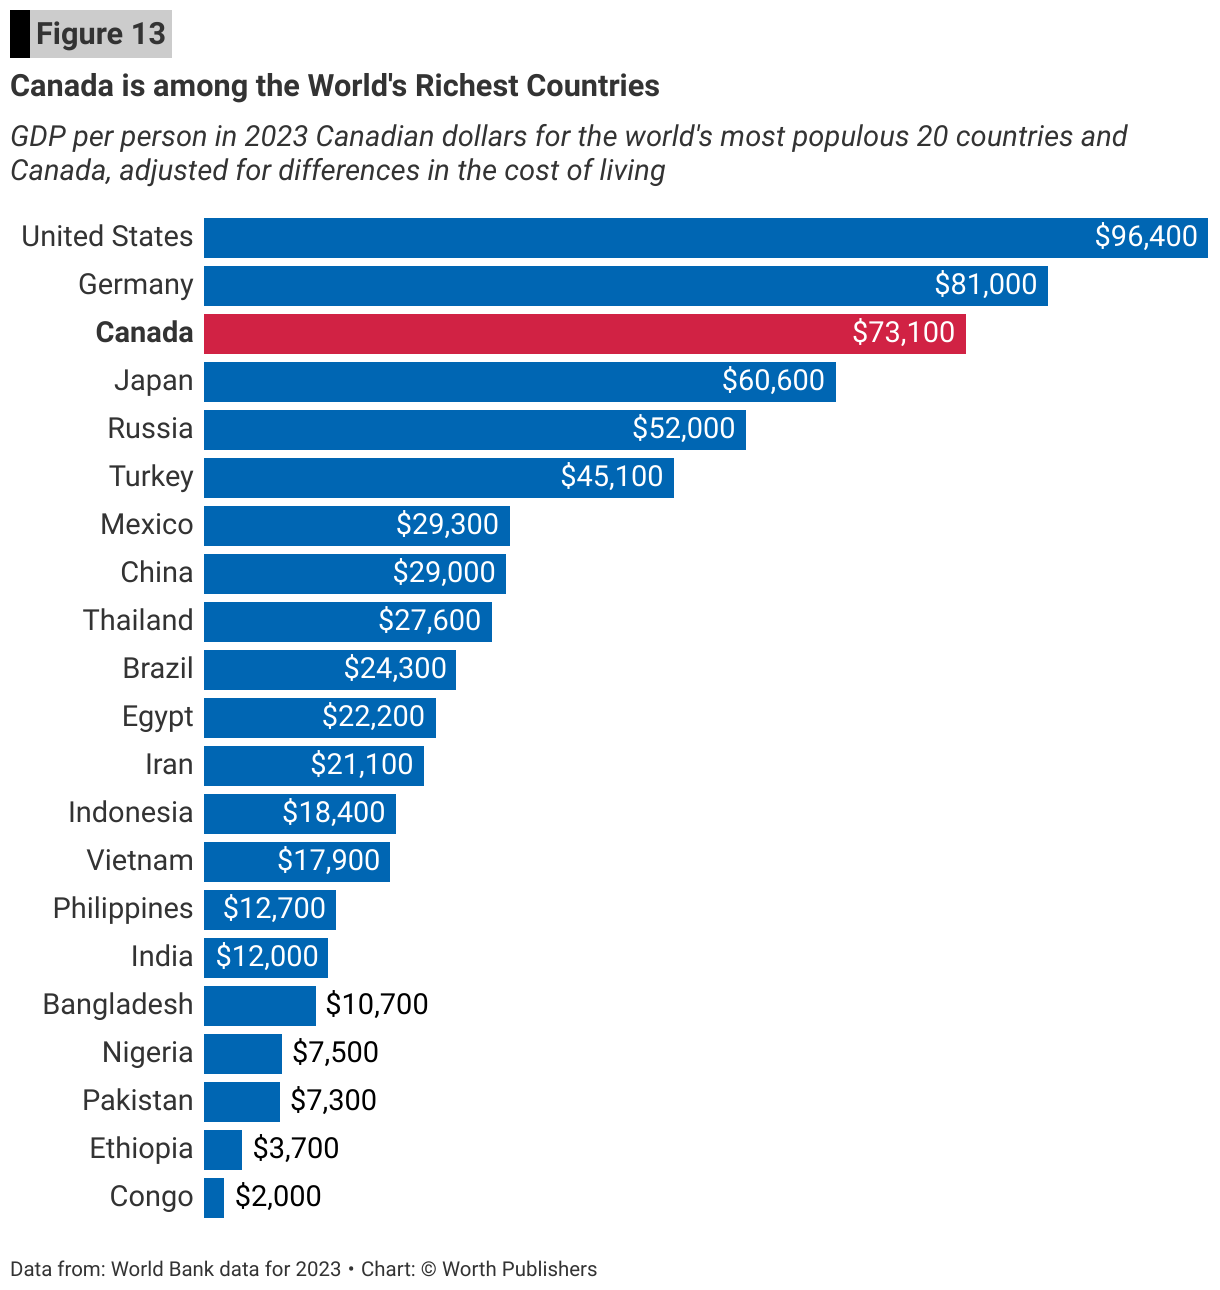
- In 2021, GDP was $2.5 trillion
- This is a very big number and so we'll focus on GDP per capita (GDP per person) which is total GDP divided by population
- $2.5 trillion divided by 38.2 million people is a GDP of $65,300 in 2021. What this means is:
- Average income per person was $65,300 in 2021
- Average output per person was $65,300 in 2021
- Average spending per person was $65,300 in 2021
9.2 - GDP Measures Total Spending, Output, and Income
Since GDP is 3 things at once (total income, total output, total spending), there are 3 ways to measure GDP:
- by adding up every dollar of spending
- by adding up every dollar's worth of output produced
- by adding up every dollar of income earned
So we can get a good estimate, the government will do all 3.
Consider: The story begins with Chisholm Lumber, a family-owned lumber company in Ontario. Chisholm Lumber chops down and transforms trees into lumber that can be used to make furniture. The company might sell $400 worth of lumber to Simmons Upholstery, a furniture manufacturer in Toronto. Simmons Upholstery turns that lumber into a couch that it will sell to a retailer, such as Leon’s, for $1,000. (While couches also need other inputs like fabric, cushion fillings, nails, and glue, we’ll put these aside for now to keep things simple.) Leon’s markets the couch and sells it to a happy customer for $1,500
There are three ways to measure the GDP accrued:
GDP Measures Total Spending - Perspective One
- The sum of total spending in the economy
- Useful because you can measure exactly who is spending and exactly what they're buying.
- Businesses, households, governments, or foreigners
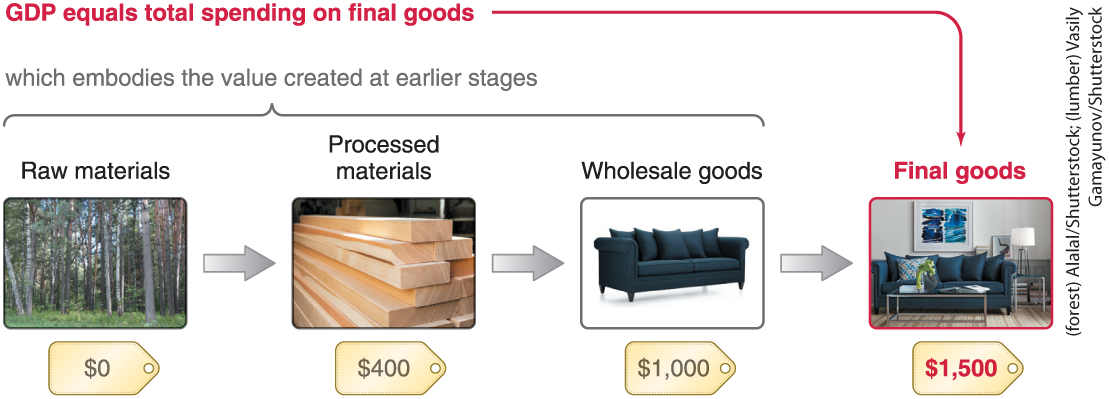
GDP is the total spending on final goods
- The key transaction occurs when the final user buys the couch at Leon's
- The focus is on the final good - in this case, the couch
- In this case, the total GDP created is $1500
- We don't count raw materials, processed materials and wholesale goods. Consider this image:
GDP measures new inventories
- GDP only measures goods in the year they're produced (that's the "P" in "GDP")
- If a couch was produced in 2025 but sold in 2026, the GDP is counted towards the GDP of 2025
- This is why we also count goods that haven't been sold yet but have been produced (new inventories)
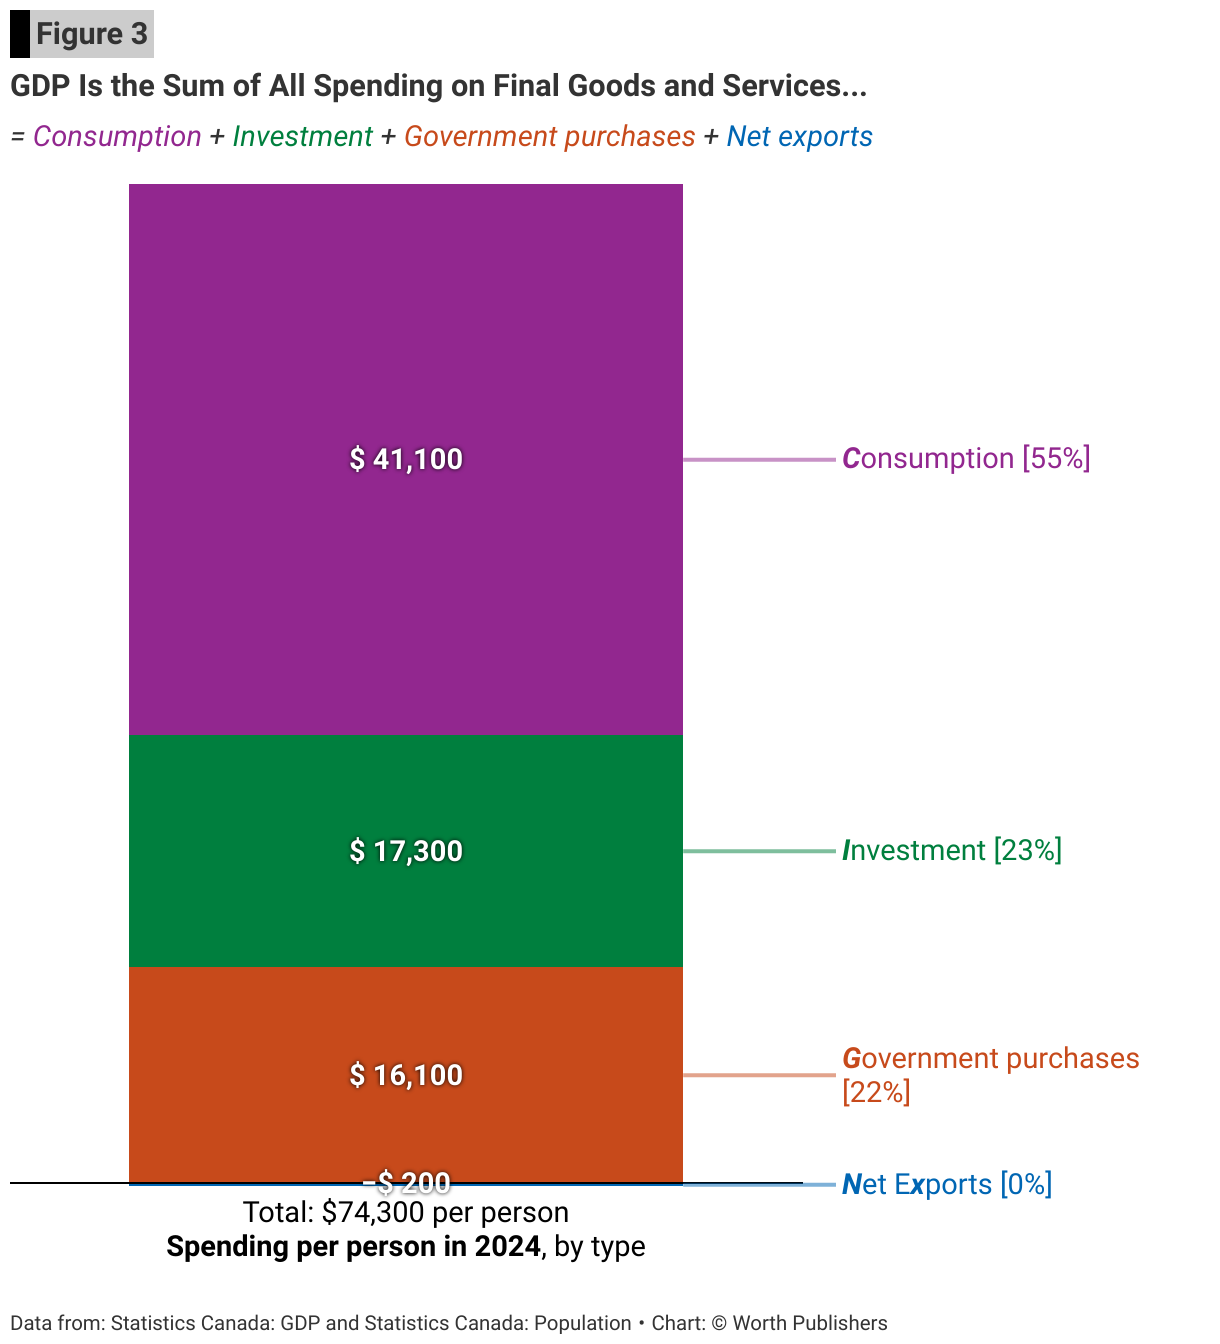
GDP is the sum of consumption, investment, government purchases, and net exports
- Benefit of measuring GDP by tracking spending is that you can track who is doing all the spending and what they're buying
- Economists use this abbreviation: Consumption is denoted by C; Investment is denoted by I; Government purchases are G; Net eXports is NX. GDP is denoted by Y. (Why? Y not)
GDP Includes:
- Goods such as food, clothes, gas
- Services such as doctor visits, bus fares, cell phone bill
- Also includes durable goods - long-lasting goods such as cars, couches, washing machine
- Money spent on rent
- GDP also counts an imputed rent - an estimate of the rental value of your home (More on this in Chapter 13)
- Business purchases (investments)
- Refer to spending on new capital assets
- It includes both the purchase and the production of long-lived assets that contribute to future production
- Example: building a factory
- IT DOES NOT INCLUDE: your savings, buying and selling stocks, or resale of real estate of investment
- Any government spending at all
- Includes teacher's salaries
- What doesn't count though is: government sending out billions of dollars in GST Credit and Old Age Security cheques
- Exports are products that we produce domestically
- Imports are not included in GDP
- We subtract imports from total spending.
- For example: If we import oranges, oranges will already be counted from household spending, so we don't want to double count
GDP Measures Total Output - Perspective Two
- Sum of total output across every business
- Highlights what's being made and by whom
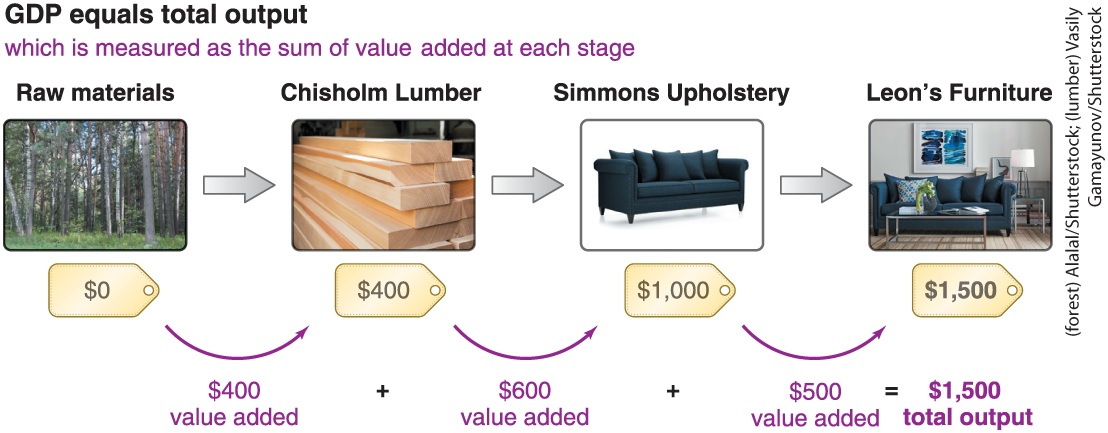
- At each step in the production process, a company uses material prepared by others, which is then transformed into something more valuable
- The amount by which the company increases the value of an item is called its value added, and it is a measure of the contribution toward producing that item
- Meaning, the company's value added is
- Meaning, the company's value added is
- The amount by which the company increases the value of an item is called its value added, and it is a measure of the contribution toward producing that item
- From our example, there's $400 of lumber that sold. Then, Simmons Upholstery turned that into $1000, which means that there was $600 in value added. Then, Leon's sold that couch for $1500, so it's efforts added another $500 in value added.
- Altogether, creating
- Altogether, creating
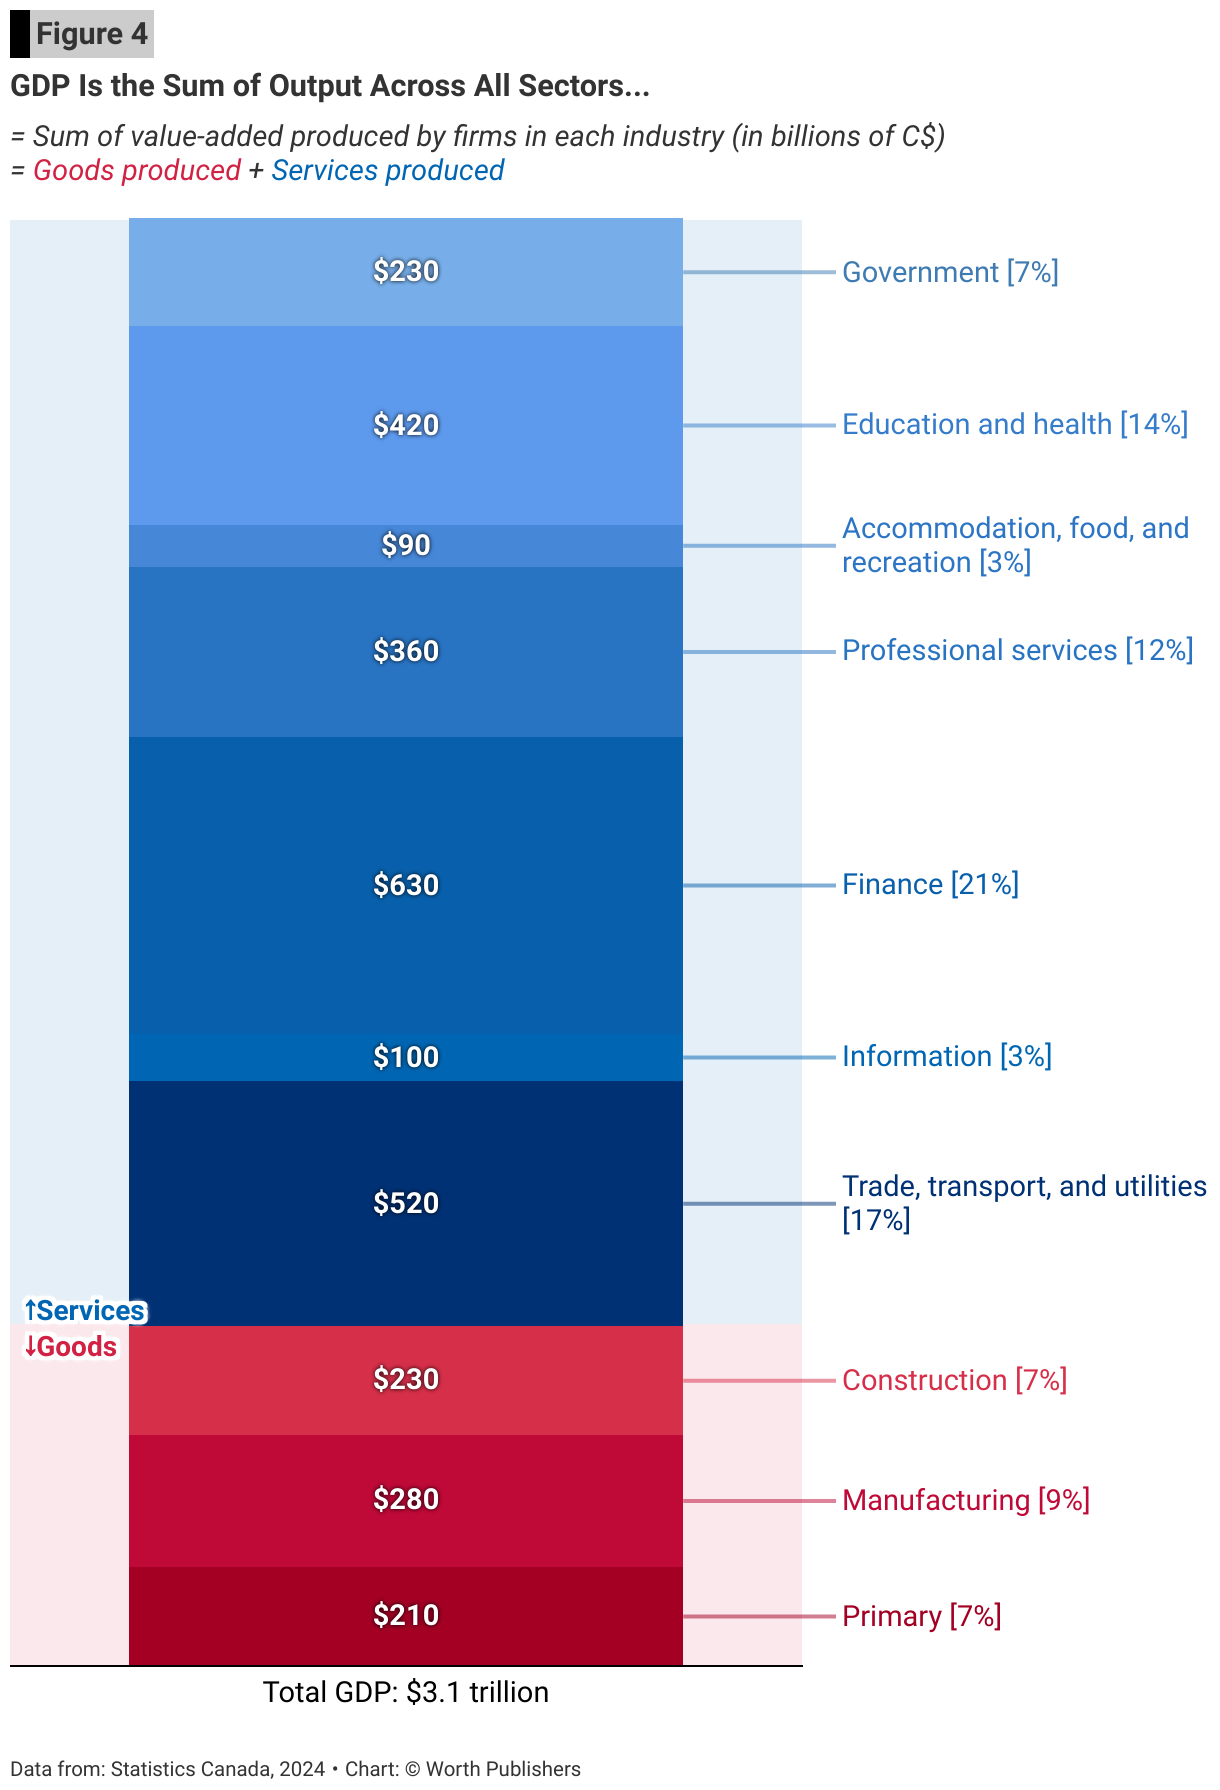
Service sector dominates in Canadian economy:
GDP Measures Total Income - Perspective Three
- Useful because GDP per person measures average income
- You can use this to evaluate material living standards in a country, whether they're improving
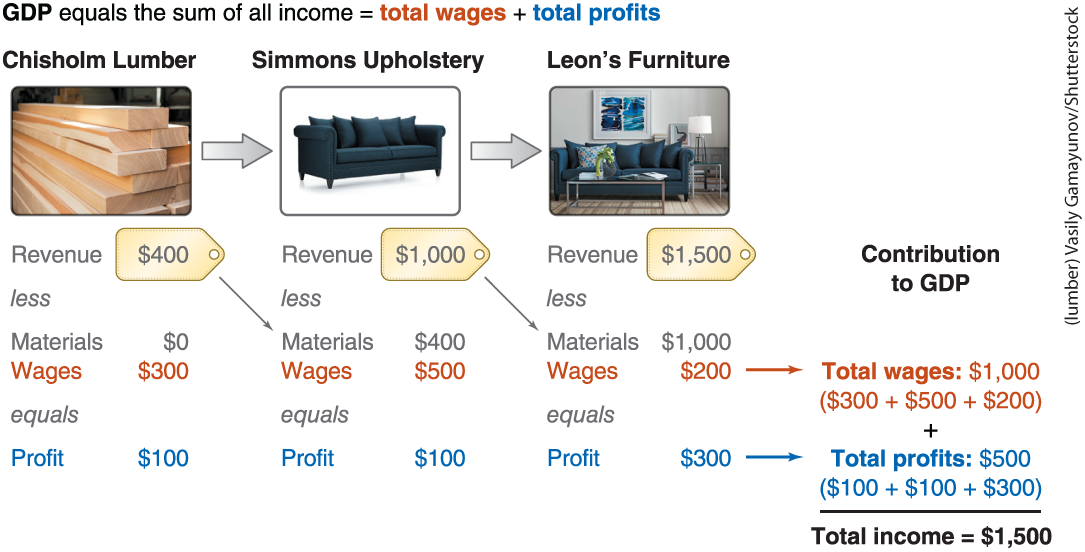
- Total Wages - Gross domestic income
- Adding up all the wages earned by workers, as well as profits that shareholders and business owners earn
- Going back to our couch example: Chisholm Lumber started with raw materials that cost nothing, and ended up with $400 of revenue. In terms of income flows, it paid $300 in wages to its workers, leaving it with a $100 profit. Simmons Upholstery got $1,000 revenue from selling its couch, and paid $400 to Chisholm Lumber, and spent an additional $500 on wages, so the company was left with $100 in profit. Finally, Leon’s got $1,500 from selling a couch it bought for $1,000. It paid $200 in wages and salaries, which left it with a $300 in profit. Across all three firms, total wages add up to $1,000 and total profits add up to $500.
- When you sell an existing asset (shares, land, financial assets), it doesn't count as income, and thus doesn't count towards GDP
9.3 - What GDP Captures and What It Misses
Limitations of GDP
- Prices are not values
- GDP is the market value for all goods and services, so it essentially sets its value equal to its market value
- Something may be more valuable to me than what I spent - that is my consumer surplus
- Nonmarket activities - including household production - are excluded
- GDP only measures goods and services sold in markets, which misses a lot productive activity
- It misses things like: laundry, cleaning apartment, washing car, mowing your lawn, playing with pets, feeding them, bathing them, etc.
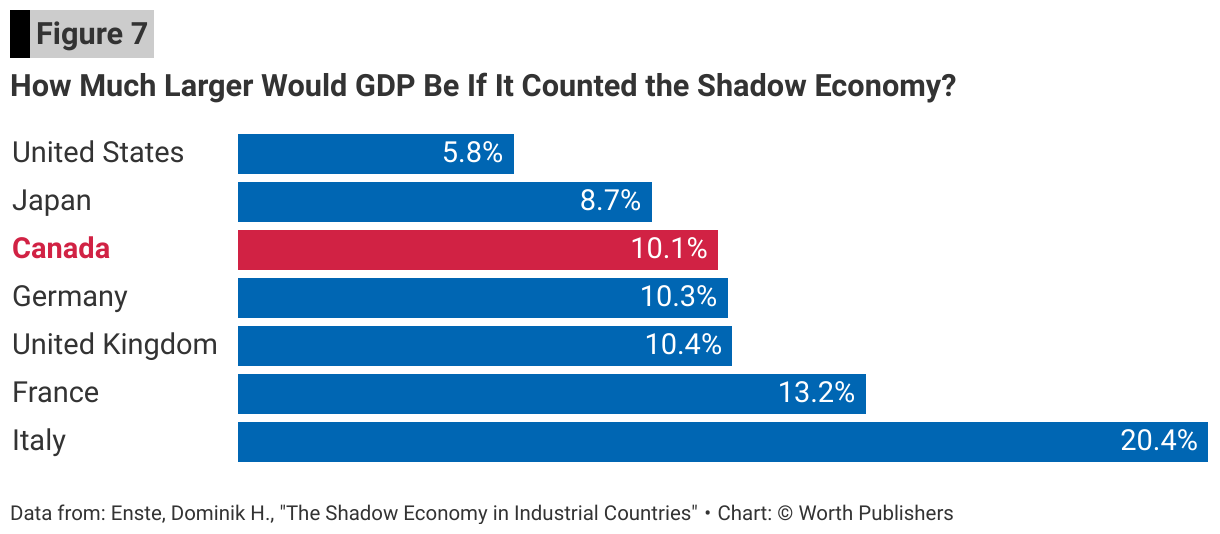
- The shadow economy is missing
- It usually involved illegal products such as drugs, banned services (like gambling), businesses operating without necessary licenses, workplaces that disregard labour standards, or using cash to avoid paying taxes
- Includes organized crime, guitarist on a street, plumber who repaired your sink and asked for cash payment
- Measuring the shadow economy:
- Usually occurs in cash, so excessively strong demand for currency for transactions is an indicator of a thriving shadow economy
- In 2017, there was $1,571 billion U.S. dollars in circulation worldwide, of which $1,252 billion was in $100 bills.
- It's suspicious because these aren't often used in transactions
- Probably used for the shadow economy!
- Experts guesstimate the size:
- Environmental degradation isn't counted
- GDP treats natural resources as if they contain no value until they're transformed into something else
- It treats nature as it's free. For example, destruction caused by cutting trees is seen to GDP only as a $400 production value.
- Leisure doesn't count
- Using opportunity cost principle! If you work more, you have less time for leisure. That means, there's a boost to GDP, but your overall happiness doesn't necessarily go up, if anything goes down.
- For example: France's great laws for workers (35-hour workweek, great benefits) mean French people, on average, work 300-400 fewer hours per year than a typical American or Canadian. This also means though, 22% lower GDP per person
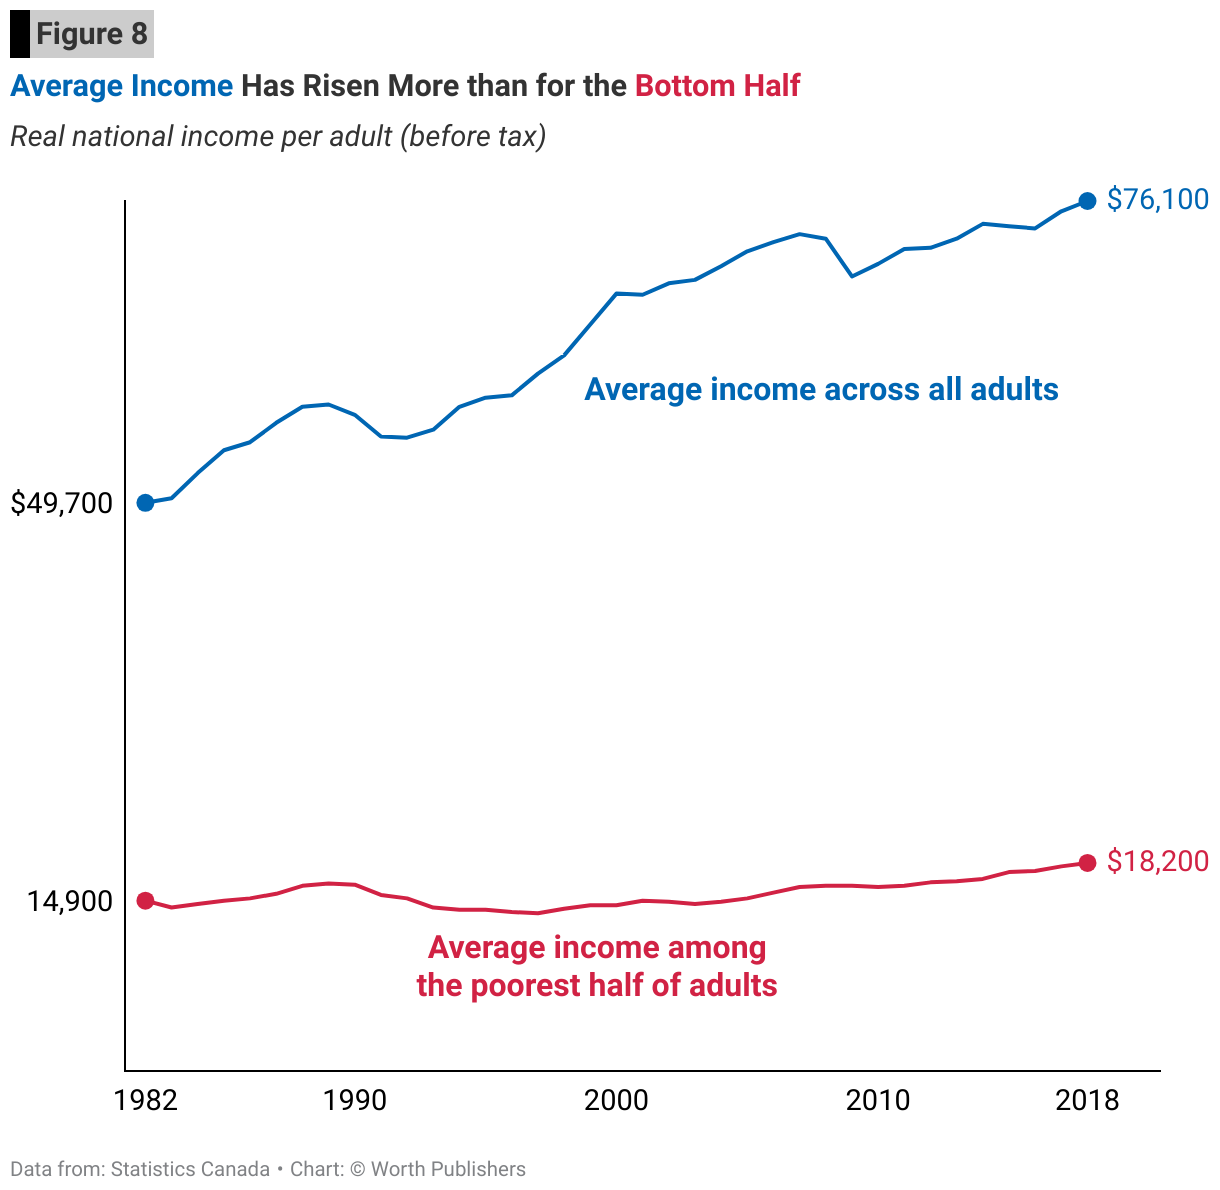
- GDP ignores distribution
- GDP per person is an average, but people care about their actual slice of the proverbial pie
- Distribution of income matters as well
GDP as a Measure of Living standards
- GDP per person measures average income in a country - higher income makes it easier to invest in children's health, education, creating beautiful art and poetry, taking time to invest in personal relationships
- By this argument, GDP doesn't measure what matters, but measures the resources that a society has available to pursue what matters
- People who live in countries with higher GDP per person tend to enjoy better life outcomes
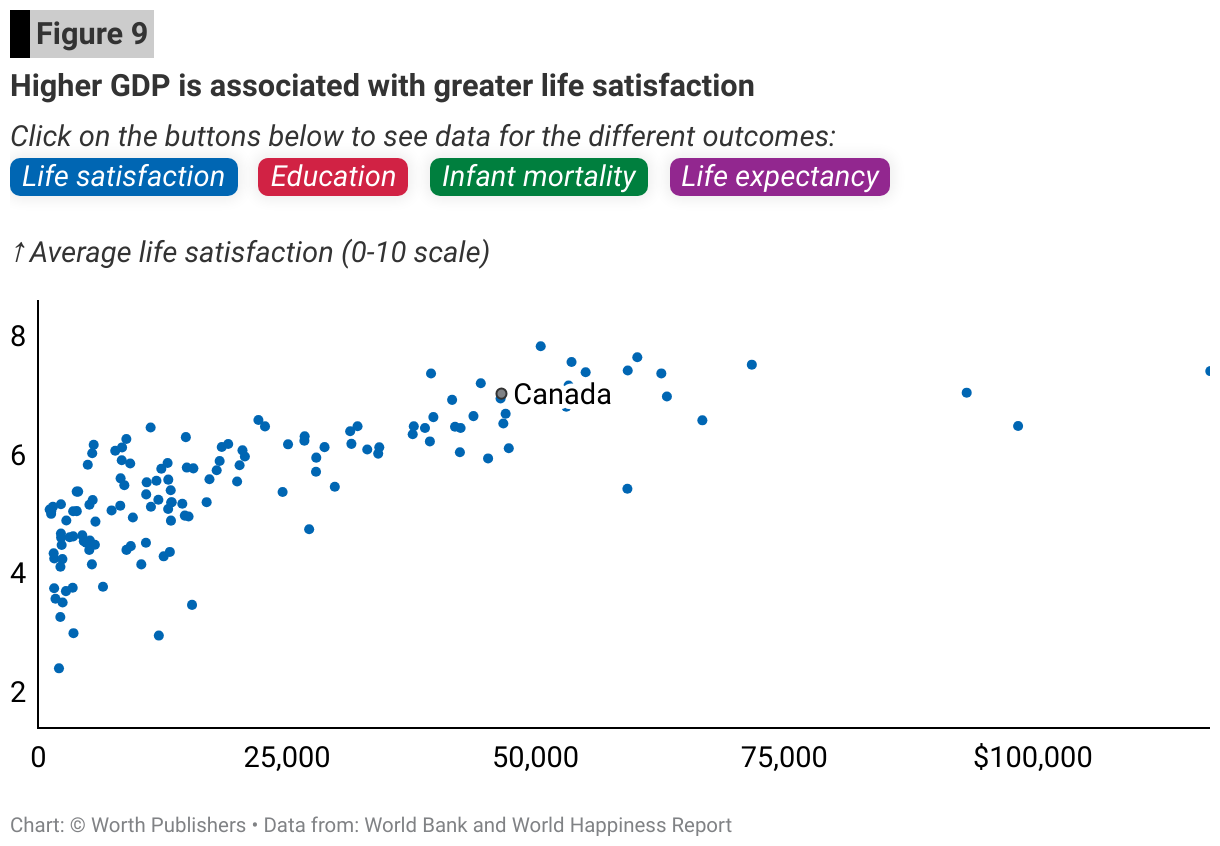
- In countries with higher GDP per person, people:
- get more education,
- live to older ages on average,
- have fewer babies die before their first birthday
- This fact is partly because higher GDP is associated with better access to a variety of necessities - like water, sanitation, food, shelter, education, etc.
9.4 - Real and Nominal GDP
- Nominal GDP is GDP measured in today's prices.
- Add up the market value of total production in a year
- Not very useful for making comparisons over time because of inflation. This means nominal GDP rises even if actual production is unchanged.
- Real GDP is GDP measured in constant prices, so that it excludes the effects of price changes
- If we focus on changes in GDP due to changes in quantity of output produced, real GDP isolates economic growth
- Add up GDP as if no price changed between last year and this year
- If economists talk about GDP, it's almost always "growth in real GDP"
How to Calculate Real GDP
- You basically just use the average price between the two years
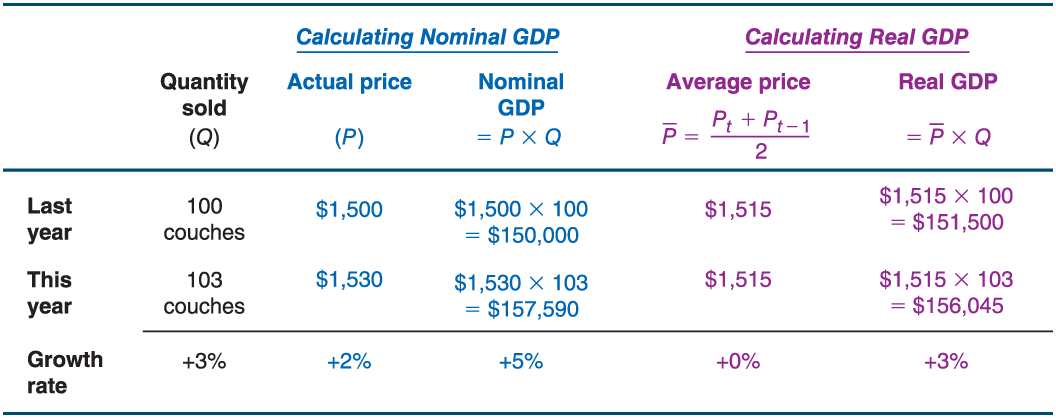
A quick trick:
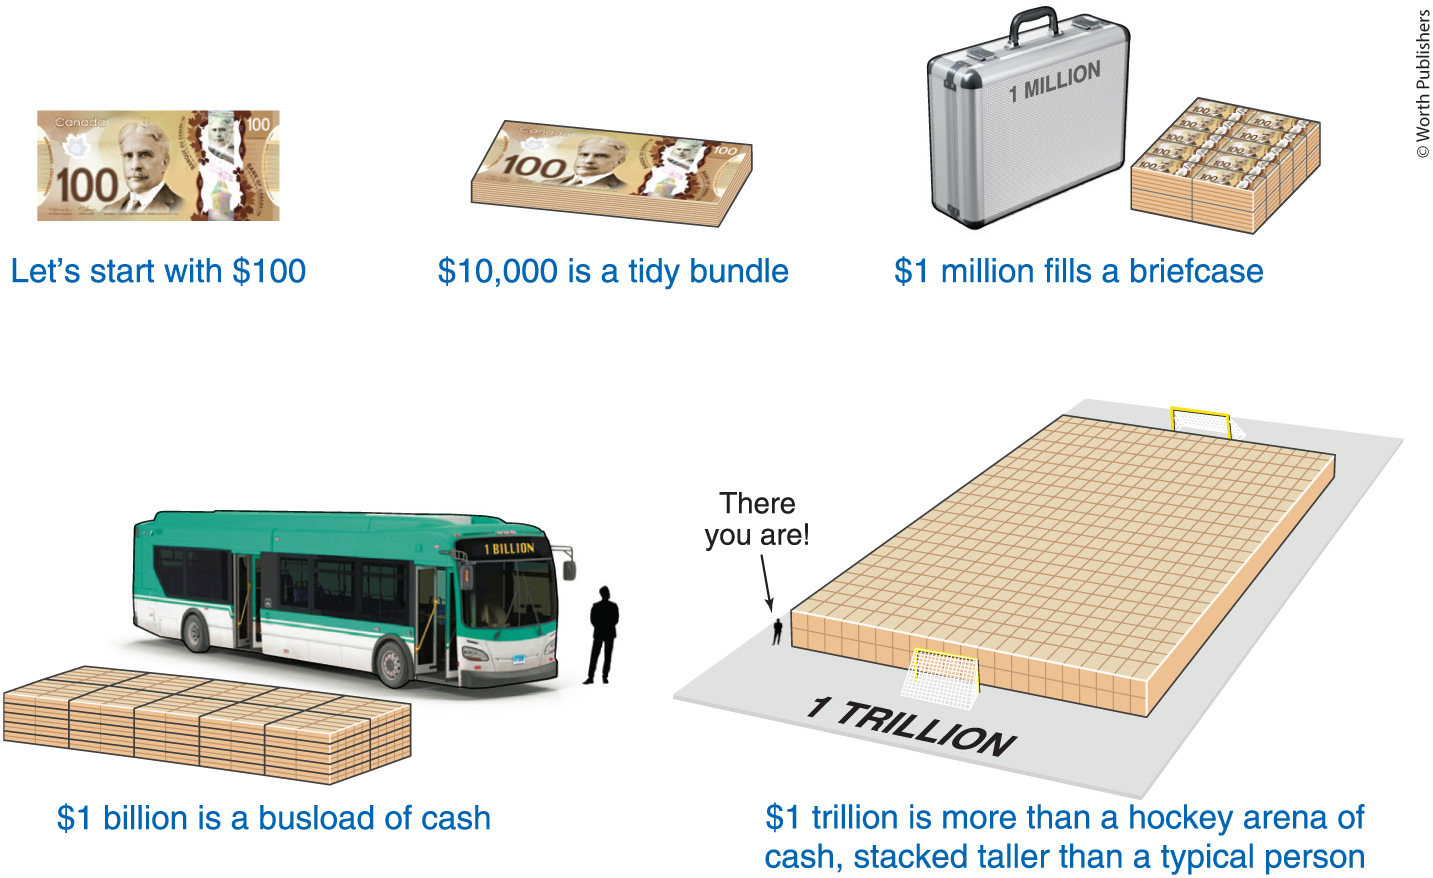
9.5 - Millions, Billions, and Trillions
- One million dollars is less than the Canadian government spends every 90 seconds
The Problem of Big Numbers
- We have very little experience with them
- Small numbers are everywhere in day-to-day life and they're easy to make sense of
- It gets to a point where big numbers start to lose meaning to people
- Visualize the difference!
Strategies for scaling big numbers:
Strategy One: Evaluate what it means per person
- In 2021, total GDP was $2.5 trillion, but it is more intuitive to think of this as $65,300 per person
- Baseline numbers:
- World population is over 8.2 billion
- Canadian population is about 41.5 million
- There are just under 15 million households in Canada
Strategy Two: Compare big numbers to the size of the total economy
- Example: In 2021, the federal government's budget deficit - its outlays less its revenues from taxes and other sources - was $114 billion. Compare it to total GDP, you'll see that the budget deficit was equal to 4.6% of GDP
Strategy Three: Compare big numbers to their own history
- This is what percentage changes do
- Example: On average, 1.9 million Canadians were unemployed in 2020 during the first year of coronavirus pandemic
- Compare this to 2019, that's a 50% increase
Strategy Four: Use the Rule of 70 to evaluate long-run growth rate
- This is a rule of thumb
- It states that you can figure out, approximately, how many years it will take something to double if you divide 70 by it's annual growth rate:
Example: Between 1971 and 2005, real GDP per person in Canada grew at an average rate of 2% per year. At that rate, it would take
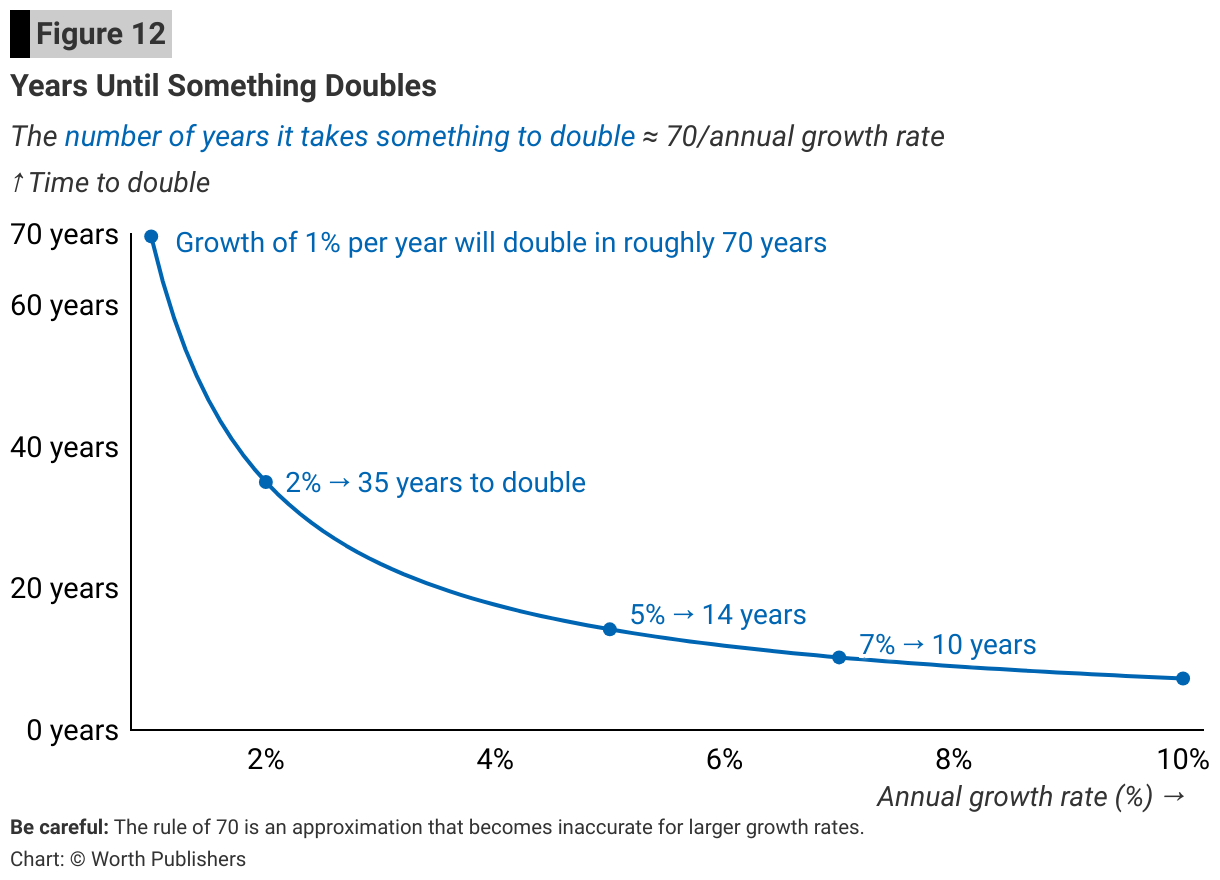
9.6 - Tying it Together